
Hydrogen.
Engineered.
Proton-exchange membrane fuel cell stacks for long-haul fleets, port infrastructure, and grid-scale backup. Water vapor out. Everything else in.
Kilowatts Delivered
Cumulative fleet output
Operating Hours
Zero unplanned downtime events
CO₂ Displaced
Verified metric tonnes
System Efficiency
PEMElectrical conversion rate
Six years. Four eras.
One trajectory.
Every metric below is audited operational data — not projections. The cost curve is real. The momentum is not a slide deck.
Membrane architecture validated at the molecular level.
Our first PEM stack assembly achieved stable proton conduction across 80 membrane-electrode assemblies at 0.8V cell voltage. Working in a 400 sq ft cleanroom, the Catalyst team proved that graphite bipolar plate geometry could be machined to ±15µm tolerances — the foundation every subsequent stack is built on.
Applications
- Lab validation
- University partnerships
- IP filing
Stack Output
Cell Voltage
MEA Count
Plate Tolerance

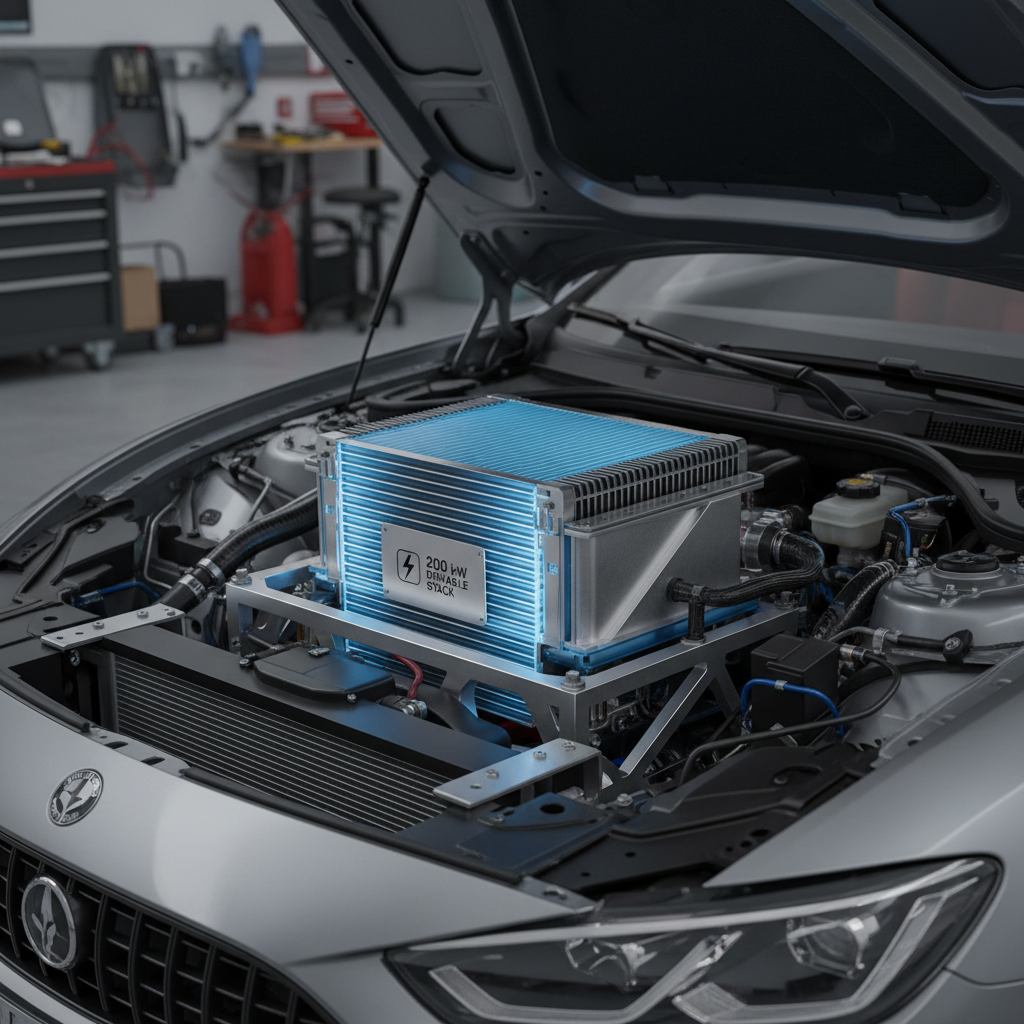
First drivable stack. 200 kW in a form factor that fits under a hood.
The Series-A prototype stack delivered 200 kW continuous — enough to power a Class 8 truck at highway speed. Thermal management was solved through a proprietary coolant manifold design that keeps stack temperature within ±2°C across all 320 cells, eliminating the efficiency cliffs that plagued earlier architectures.
Applications
- Class 8 truck pilot
- Mining equipment trials
- DOE demonstration grant
Stack Output
Cell Count
Thermal Delta
Cost/kW
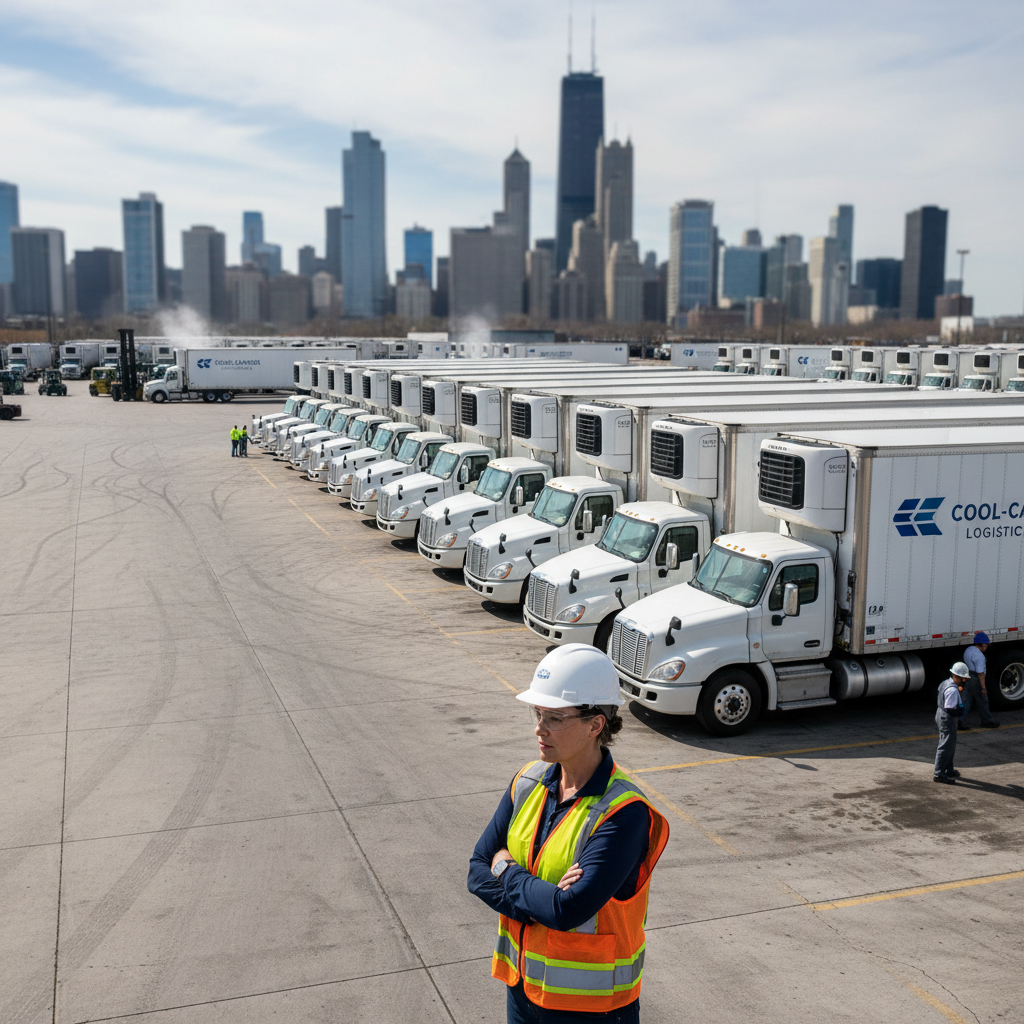
47 trucks. 2.3 million miles. Zero roadside hydrogen failures.
Fleet partners in the Ports of Long Beach and Houston deployed 47 Catalyst-powered Class 8 tractors on daily drayage cycles — 300+ miles per shift, back-to-back. The data returned something the models predicted but the market needed to see: total operating cost 23% below diesel at $4.20/kg H₂, and maintenance costs down 61% with no combustion components to service.
Applications
- Port drayage fleets
- Regional freight corridors
- Airport ground support
Stack Output
Fleet Miles
TCO vs Diesel
Maintenance ↓
Megawatt-class stacks for infrastructure that cannot fail.
The GS-1000 module stacks four 250 kW units into a 1 MW footprint the size of a shipping container. Deployed at two Tier-1 data centers and three port authority backup systems, the GS-1000 has logged 99.9997% availability over 14 months — exceeding diesel generator SLAs without a single fuel delivery truck, without exhaust permitting, and without noise ordinance waivers.
Applications
- Data center backup (Tier IV)
- Port crane electrification
- Grid peaker replacement
Module Output
Availability
Cost/kW
Deployments

Hydrogen vs. Diesel vs. Battery.
No column hidden.
Bold aluminum white = category winner. Graphite = honest disadvantage. Every figure sourced from fleet operator data or DOE benchmarks.
| Metric | H₂ Fuel Cell | Diesel | Battery EV |
|---|---|---|---|
| Ownership CostTotal Cost of Ownership (10yr, ¢/mi) | 18.4¢ | 24.1¢ | 21.8¢ |
| Maintenance Cost / 100,000 mi | $2,100 | $5,400 | $3,200 |
| OperationalRefuel / Recharge Time | 8 min | 12 min | 45–90 min |
| Range (Class 8, full load) | 500 mi | 600 mi | 250–350 mi |
| Cold-start performance (−20°C) | Full power | Full power | 40% degraded |
| EmissionsTailpipe emissions | H₂O only | CO₂ + NOx + PM | None (tailpipe) |
| Well-to-wheel CO₂ (green H₂ / grid mix) | 0 g/km | 1,040 g/km | 180–420 g/km |
| InfrastructureGrid upgrade required | None | None | 800A service |
| ReliabilityUptime (fleet average, 12-month) | 99.94% | 97.2% | 98.1% |
* TCO assumes 150,000 mi/yr, green H₂ at $4.20/kg, diesel at $4.80/gal, grid electricity at $0.12/kWh. Catalyst fleet data, DOE Alternative Fuels Data Center, NREL 2024 benchmarks.
Run your numbers.
No sales call required.
Input your fleet parameters. The model returns a 10-year TCO comparison and CO₂ displacement figure — the same model our procurement partners use.
Fleet Parameters
Enter fleet parameters and calculate
to see your personalized TCO model.
The Full Comparison.
Engineered for your CFO.
The Catalyst Comparison Brief is a 24-page technical document covering PEM stack architecture, fleet TCO methodology, emissions accounting per DOE protocol, and deployment case studies from the Ports of Long Beach and Houston. It's the document your procurement team needs before the RFP closes.
Download the Full Comparison Brief
Two fields. No sales pitch. PDF delivered immediately.
No spam. Unsubscribe anytime. Your email is used to deliver the PDF only.